What the Taylor rule says about the Fed reserve policy rate now
A 33-year-old formula is still the benchmark for judging interest rates, and today it points above the Fed's 3.75 to 4% under five of the six versions I tested. The reasons the Fed has not followed it are as informative as the rule itself.
On 16 September the Federal Reserve raised its policy rate by a quarter point, to a range of 3.75% to 4.00%, the first increase in more than three years. The statement was brief on the reason, noting only that inflation "remains elevated". Whether the new level is high enough is now the question every Fed policy rate monitor is asking, and one of the oldest tools in monetary economics offers a ready answer.
John Taylor, an economist at Stanford, published that tool in 1993. Thirty three years later the Taylor rule remains the most widely used yardstick for benchmarking the Fed policy rates. Per our research it currently points above the Fed under five of the six versions I tested. This analysis argues that the gap should be read as a signal of direction rather than an instruction. The reasons the Fed has not followed the rule are, in practice, as informative as the rule itself.
Context: a benchmark the Fed still consults
Taylor's original paper, "Discretion versus policy rules in practice", made a modest claim. It did not suggest that the Fed should hand its decisions to a formula, but rather showed that a simple rule, reacting only to inflation and to the state of the economy, described the Fed's actual decisions between 1987 and 1992 remarkably well.
That observation has since turned into a benchmark. The Fed's twice-yearly Monetary Policy Report to Congress now compares the actual policy rate with several versions of the rule, while the Federal Reserve Bank of Cleveland updates its own prescriptions every quarter. The Fed's wording sets the tone: policymakers "consult, but do not mechanically follow, policy rules". In its July 2026 report, the Fed acknowledged that the rules "called for levels of the policy rate in the first quarter of this year that were a little above" its target range at the time. September's increase moved policy in the direction the rules had been pointing.
Framework: one line of arithmetic, four assumptions
The rule fits on one line. The policy rate should equal:
the neutral real rate + inflation + half of (inflation minus 2%) + half of the economy output gap
Each term carries an assumption, and each assumption matters.
The neutral real rate is the inflation-adjusted interest rate that neither accelerates nor slows the economy. It cannot be observed, only estimated. Taylor assumed 2% while the Fed's own long-run projections currently imply about 1.2%: a long-run policy rate of 3.2%, less 2% inflation.
Inflation is measured the way the Fed prefers, through the core personal consumption expenditures (PCE) price index, which excludes food and energy, over the past twelve months.
The inflation gap is where the rule does its real work. If inflation runs one point above the 2% target, the rule raises the policy rate by one and a half points. The first point simply keeps the real interest rate where it was; the additional half point is what actually tightens. This is the Taylor principle: in bringing inflation down, a central bank must raise rates by more than inflation itself has risen.
The economy output gap measures how far the economy is running above or below its sustainable capacity. Like the Fed, I estimate it from unemployment, using a rule of thumb known as Okun's law, under which each point that unemployment sits below its natural rate counts as roughly two points of output gap.
Applying today's numbers makes the logic concrete. Core inflation was 3.0%in July and August, while unemployment averaged 4.1% in the third quarter, against a natural rate the Congressional Budget Office puts at 4.4% which implies an output gap of about plus 0.5. With the Fed's own neutral rate of 1.2%:
1.2 + 3.0 + 0.5 x (3.0 minus 2) + 0.5 x 0.5 = about 5.0%
That is a full point above the middle of the Fed's current range. Using Taylor's original 2% neutral rate, the answer rises to 5.75%. Even with a neutral rate as low as 0.5%, it still stands at 4.25%, above the top of the range.
Anyone who has built a valuation model will recognise the structure. The output looks precise, but it is only as reliable as the discount rate behind it, and the neutral rate plays exactly that role here.
Evidence: twenty-six years against the rule
The chart below runs the rule across every quarter since 2000. Because the neutral rate cannot be observed, the rule is shown as a range rather than a single line, from a neutral rate of 0.5% at the bottom to Taylor's 2%at the top. The blue line is what the Fed actually did.
Four episodes stand out, and each tells a different story.
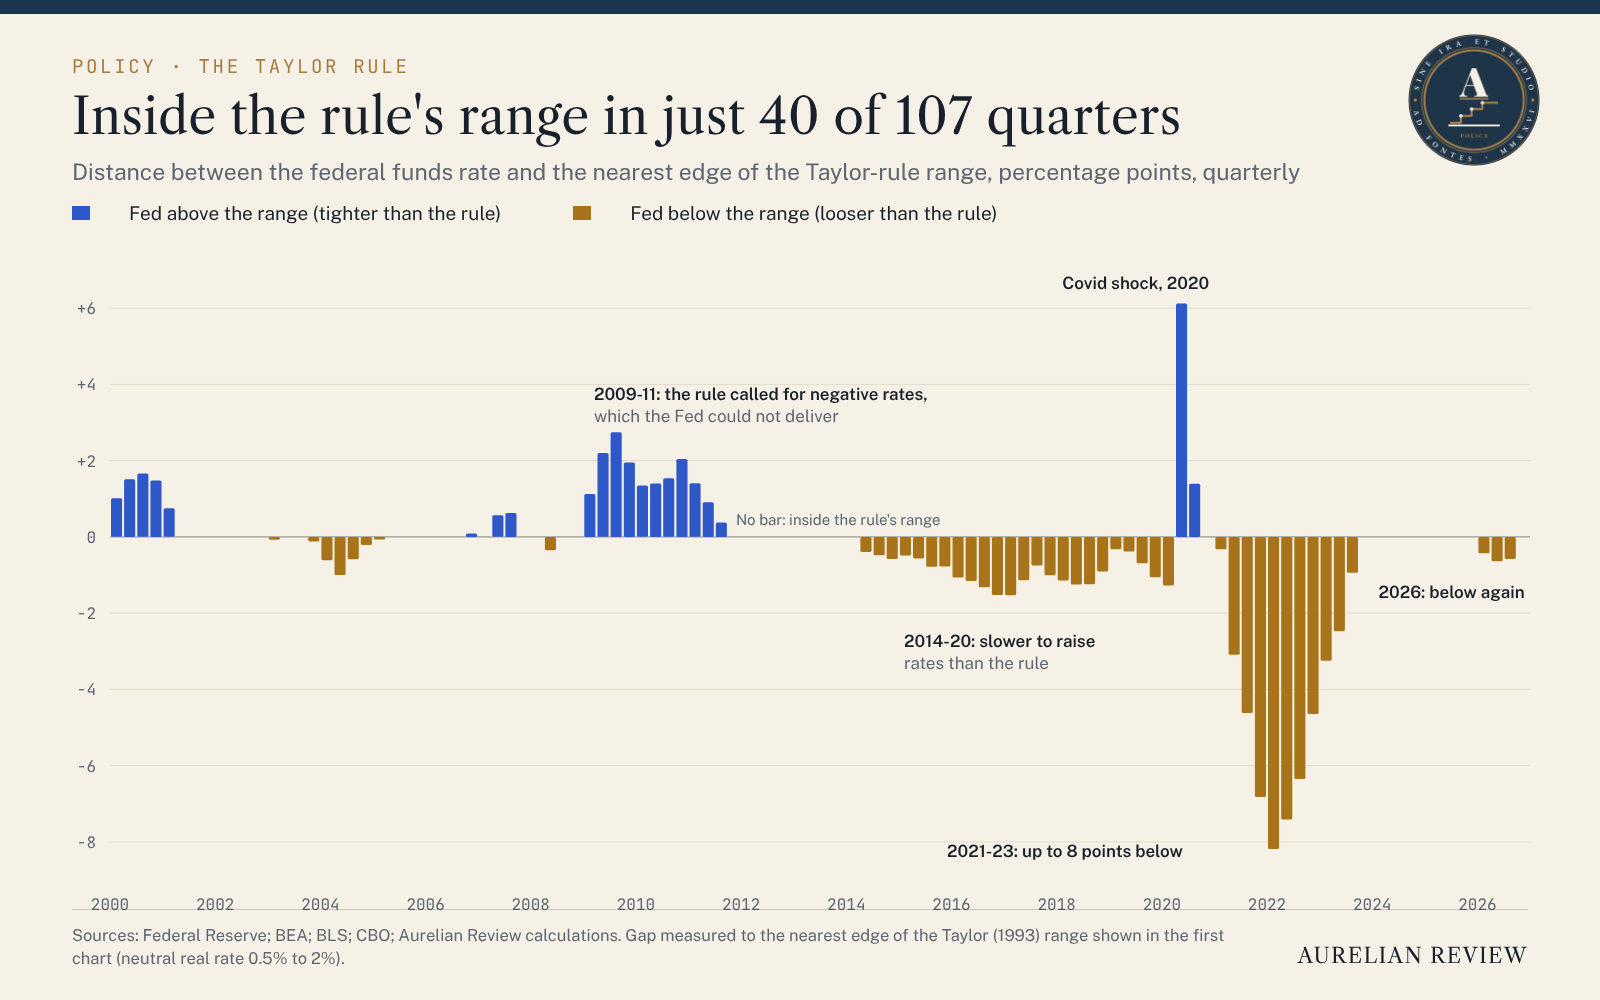
2003 to 2005. Following the dot-com bust, the Fed held its rate at 1% up to a point below the rule's range. Taylor later argued, at the Kansas City Fed's Jackson Hole symposium in 2007, that this deviation "may have been a cause of the boom and bust in housing starts and inflation". Ben Bernanke, who chaired the Fed from 2006 to 2014, disputed this in 2015: measure inflation with core PCE and give the output gap a weight of one rather than a half, and the gap disappears. Both men used the same rule; the disagreement was about its settings rather than its logic.
2009 to 2015. After the financial crisis the rule called for negative rates, as low as minus 4% at the bottom of the range in 2009. Considering rates cannot go meaningfully below zero, the Fed held them near zero and bought bonds instead. The Fed looks "too tight" on the chart in this period not because of a policy error, but rather because the rule asks for something no central bank can deliver.
2021 to 2023. This is the widest gap since at least 2000. As inflation rose in 2021, the Fed kept its rate near zero, judging the surge to be temporary. In the first quarter of 2022, with core inflation at 5.5%, the rule prescribed between 8.3 and 9.8% while the Fed's rate averaged 0.1%. What followed was 5.25 points of tightening in sixteen months, and by the end of 2023 the Fed was back inside the rule's range.
2026. The Fed has moved below the range again, by around 0.6 points at its nearest edge in the third quarter. September's increase narrowed the gap, but did not close it.
Across the full period, the Fed sat inside the rule's range in 40 of 107 quarters, a little over a third of the time. That isn't evidence that the rule has failed, but rather that it was never meant to be the only input.
Interpretation: why the gap isn't a verdict
It would be easy to read these gaps as the Fed ignoring the rule; however, that reading is too narrow. The rule cannot settle the question on its own, for four reasons.
First, its key inputs are estimates. Moving the neutral rate from 0.5 to 2% shifts the prescription by a point and a half. Swapping core for headline inflation, which includes energy and stood at 3.4% in July and August, raises the answer again. A rule that returns a range of 4.25 to 5.75% gives a strong signal of direction, rather than a precise instruction.
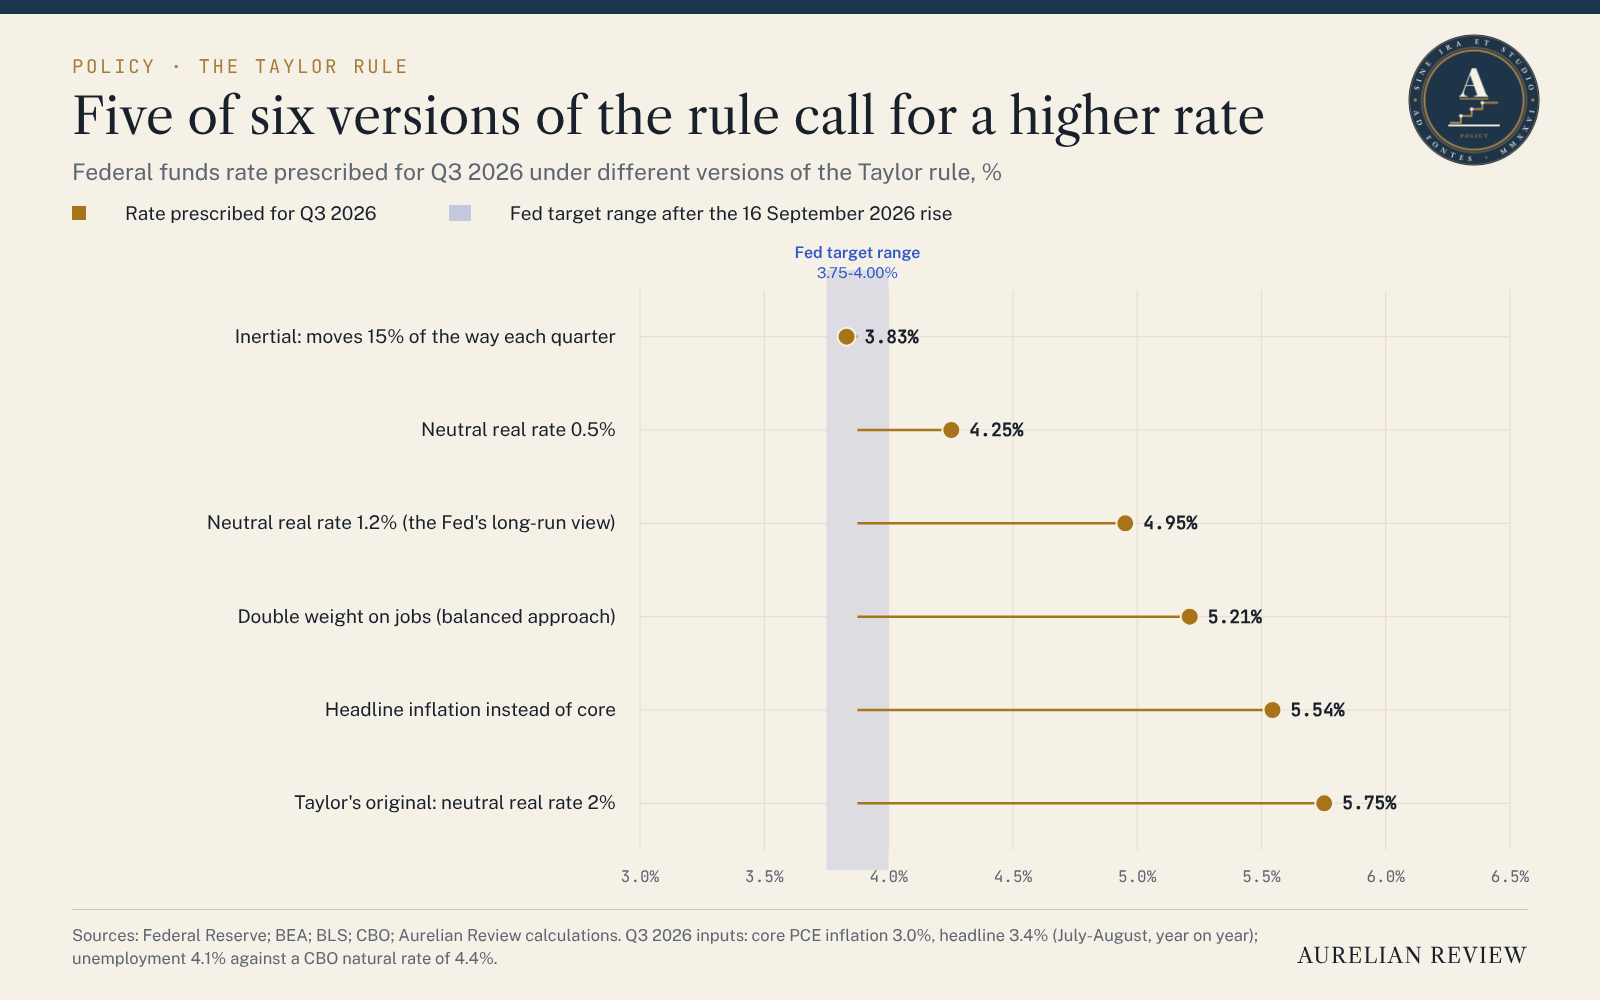
Second, central banks move gradually. A version of the rule that moves only 15%of the way towards its answer each quarter, a common way of modelling this caution, prescribes 3.83% today. That is almost exactly where the Fed stands. In practice, the Fed behaves less like Taylor's original rule and more like a patient version of it.
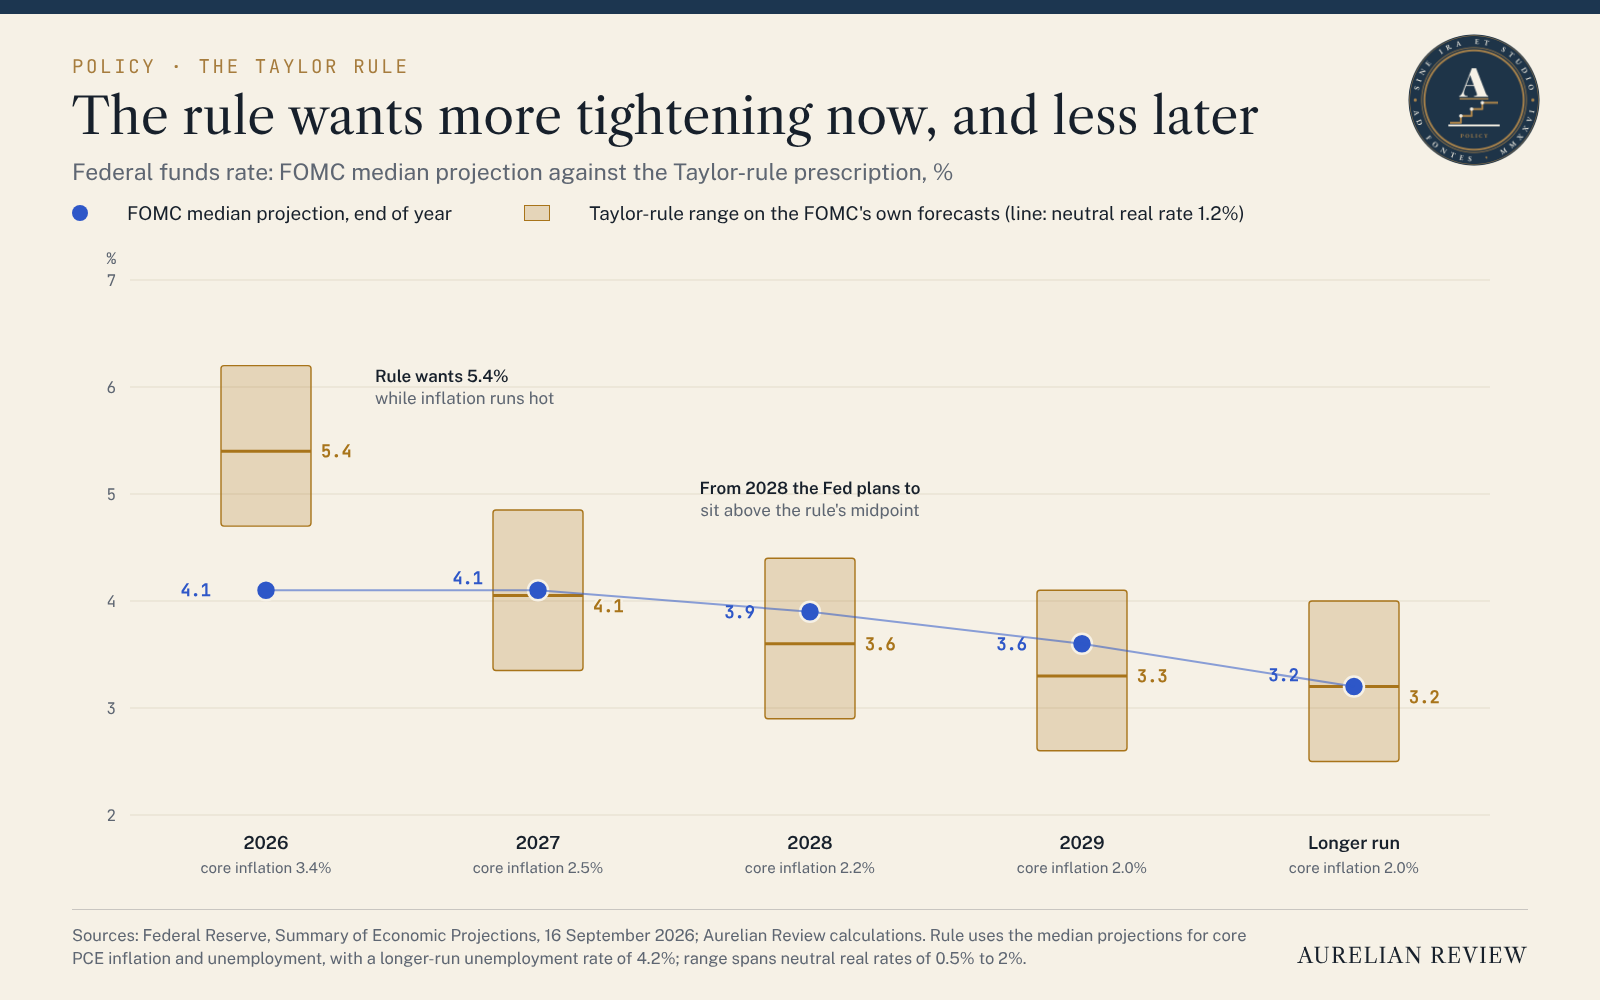
Third, the rule looks backwards. It reacts to the inflation of the past year, while the Fed sets policy on its forecast. In September, the Fed's median projection had core inflation falling from 3.4% at the end of this year to 2.5% in 2027.
Fourth, the rule cannot see everything. It knows nothing about financial stability, the Fed's balance sheet, the source of an inflation shock or the floor at zero. The Fed says as much itself: rules, "by their nature, do not capture" the complexity of the US economy.
The rule is, in that sense, a model like any other: a structured representation of assumptions, not an answer. Taylor's 1993 paper made the same point, that a rule can guide judgement without replacing it, and Bernanke's verdict remains the fairest summary: monetary policy "should be systematic, not automatic". The value of the rule lies in making any departure visible, and in asking the central bank to explain it.
Implication: watch the gap, not the formula
What comes next? Applied to the Fed's own September projections for inflation and unemployment, the rule calls for about 5.4% at the end of this year, against the Fed's median projection of 4.1%. By 2027 the two converge at around 4.1%. From 2028 the Fed expects to hold rates slightly above the rule's central path, and both settle at 3.2% in the longer run.
Method
Quarterly averages from 2000 to the third quarter of 2026. Policy rate: the effective federal funds rate. Inflation: four-quarter change in the core PCE price index; for the third quarter of 2026, July and August against the same months a year earlier. Output gap: twice the gap between the CBO's noncyclical rate of unemployment and the actual unemployment rate. October 2025 unemployment, which was not published, is interpolated. The results are in line with independent estimates: the Cleveland Fed's Taylor (1993) prescriptions for the third quarter of 2026 run from 4.80 to 6.44% depending on the forecast used, and my central estimate of 4.95% sits within that range.
Sources
Taylor, J. B. (1993) 'Discretion versus policy rules in practice', Carnegie-Rochester Conference Series on Public Policy, 39, pp. 195 to 214.
Taylor, J. B. (2007) 'Housing and monetary policy', NBER Working Paper 13682, prepared for the Federal Reserve Bank of Kansas City symposium, Jackson Hole.
Bernanke, B. S. (2015) 'The Taylor rule: a benchmark for monetary policy?', Brookings Institution, 28 April.
Board of Governors of the Federal Reserve System (2026) Monetary Policy Report, 10 July, Box 4: Monetary Policy Rules in the Current Environment.
Board of Governors of the Federal Reserve System, 'Policy rules and how policymakers use them'.
Federal Open Market Committee (2026) Statement and Summary of Economic Projections, 16 September.
Federal Reserve Bank of Cleveland, 'Simple monetary policy rules', updated 4 September 2026.
Federal Reserve Bank of St Louis, FRED: effective federal funds rate; PCE price indices (Bureau of Economic Analysis); unemployment rate (Bureau of Labor Statistics); noncyclical rate of unemployment (Congressional Budget Office).